The OpenCilk Cilkscale tool comprises three main components:
- Infrastructure in the OpenCilk compiler and runtime system for work/span
analysis,
- A C/C++ API for fine-grained analysis of program regions, and
- A Python script that automates scalability analysis, benchmarking on multiple
cores, and visualization of parallel performance results.
This reference page summarizes the work/span analysis measurements reported by
Cilkscale, and details the interface, options, and output of each component.
To learn more about how to use Cilkscale to analyze the parallel performance of
your Cilk program, see the Cilkscale user's
guide.
Note:
The terminal command examples in this page assume that OpenCilk is
installed within /opt/opencilk/, as shown in the Install
page.
Work/span analysis measurements
Cilkscale work/span analysis reports contain the following measurements for
each analyzed program region.
-
Work: the CPU time of the computation when run on one processor,
sometimes denoted . The actual wall-clock time it takes to run the
computation in parallel will generally be smaller than the work, since the
latter adds together the time spent on different CPU cores.
-
Span: the theoretically fastest CPU time of the computation when
run on an infinite number of parallel processors (discounting overheads for
communication and scheduling), sometimes denoted . The span is
the maximum amount of work along any path in the parallel trace
of the computation.
-
Parallelism: the ratio of work to span for a computation . Parallelism can be interpreted as the maximum possible speedup
of the computation, or as the maximum number of processors that could
theoretically yield perfect linear speedup.
-
Burdened span: similar to span after accounting for worst-case
scheduling overhead or "burden". The scheduling burden is based on a
heuristic estimate of the costs associated with migrating and synchronizing
parallel tasks among processors. The worst-case scenario is when every time
it is possible for a task to be migrated, the scheduler does migrate it. (In
practice, there are additional factors besides scheduling overhead that can
slow down parallel execution, such as insufficient memory bandwidth,
contention on parallel resources, false sharing, etc.)
-
Burdened parallelism: the ratio of work to burdened span. It can be
interpreted as a lower bound for the parallelism of the computation assuming
worst-case parallel scheduling (and ignoring other possible factors of
parallel slowdown).
References:
- Y. He, C.E. Leiserson, and W.M. Leiserson, The Cilkview scalability
analyzer,
SPAA 2010, pp. 145–156.
- T.B. Schardl, B.C. Kuszmaul, I.T.A. Lee, W.M. Leiserson, and C.E. Leiserson,
The Cilkprof scalability
profiler, SPAA 2015,
pp. 89–100.
Compiler options
-
-fcilktool=cilkscale
Instrument the program to measure work and span in
seconds. Work/span measurements in seconds are non-deterministic.
-
-fcilktool=cilkscale-instructions
Instrument the program to measure work and span in LLVM pseudo-instructions:
weighted counts of architecture-independent instructions based on LLVM's
internal representation and cost model. Work/span measurements in
pseudo-instructions are deterministic but introduce higher runtime overhead
than measurements in seconds.
-
-fcilktool=cilkscale-benchmark
Instrument the program to measure wall-clock execution time (in seconds)
instead of work and span.
Example:
$ /opt/opencilk/bin/clang qsort.c -fopencilk -fcilktool=cilkscale -O3 -o qsort_cs
$ /opt/opencilk/bin/clang qsort.c -fopencilk -fcilktool=cilkscale-instructions -O3 -o qsort_csinstr
$ /opt/opencilk/bin/clang qsort.c -fopencilk -fcilktool=cilkscale-benchmark -O3 -o qsort_cs_bench
Note:
The Cilkscale instrumentation flags must be used for both
compilation and linking.
Analysis report file
When a Cilkscale-instrumented program is executed, Cilkscale reports its
measurements by printing them to the standard output stream by default. To
output Cilkscale measurements into a file instead of the standard output, set
the desired file path as the value of the environment variable CILKSCALE_OUT.
Example:
$ CILKSCALE_OUT=qsort_workspan_report.csv ./qsort_cs 100000000
[...program output without Cilkscale's report...]
$ cat qsort_workspan_report.csv
tag,work (seconds),span (seconds),parallelism,burdened_span (seconds),burdened_parallelism
,26.3454,2.22239,11.8545,2.22271,11.8528
Note:
Cilkscale assumes that the path in CILKSCALE_OUT points to a file
in an existing directory.
- If the directory does not exist, the report is printed to the standard output
instead.
- If the file already exists, the report will overwrite the file's contents.
C/C++ API for fine-grained analysis
The Cilkscale C/C++ API enables fine-grained analysis of specific code regions.
If the program is compiled with the flag -fcilktool=cilkscale or
-fcilktool=cilkscale-instructions, the Cilkscale API functions measure work
and span (in seconds or pseudo-instructions, respectively) as described below.
If, however, the program is compiled with the flag
-fcilktool=cilkscale-benchmark, then the functions below measure wall-clock
execution time instead of work and span.
Note:
Calls to the Cilkscale API functions are elided if the program is
compiled without any of the Cilkscale instrumentation flags.
#include <cilk/cilkscale.h>
Work/span measurement type
wsp_t workspan_measurement_var;
Get work/span measurement at point
wsp_t wsp_getworkspan()
Return the work and span of the computation from the beginning of the program
up to the point of the wsp_getworkspan() function call in the program's
parallel trace.
Zero-initialized work/span variable
wsp_t wsp_zero()
Return a value with zero work and span measurements. Needed to initialize
work/span accumulation variables.
Work/span difference
wsp_t wsp_sub(wsp_t lhs, wsp_t rhs)
Return the work/span difference between the lhs and rhs measurements.
Useful for measuring the work and span of program regions between
wsp_getworkspan() calls.
Work/span sum
wsp_t wsp_add(wsp_t lhs, wsp_t rhs)
Return the work/span sum of the lhs and rhs measurements. Useful when
accumulating work/span measurements of non-contiguous program regions.
Print CSV row of work/span measurements
void wsp_dump(wsp_t wsp, const char *tag)
Print a tagged row with the measurements of wsp in CSV
format. The fields in
the printed row are, in order: the tag string, work, span, parallelism,
burdened span, and burdened parallelism.
See also: Cilkscale work/span analysis
measurements.
C++ operator overloads
In C++, the Cilkscale API also defines operator overloads for wsp_t
variables:
- The
- and -= operators correspond to calls to wsp_sub().
- The
+ and += operators correspond to calls to wsp_add().
- The
<< operator can be used with a prefix argument of type std::ostream
or std::ofstream to print work/span measurements. The << operator
behaves similarly to wsp_dump(), except that (1) it does not print a tag
field, and (2) its output stream is unaffected by the CILKSCALE_OUT
environment variable.
Examples
Example 1:
Measure the work and span of a computation in a contiguous
code region.
wsp_t start = wsp_getworkspan();
wsp_t end = wsp_getworkspan();
wsp_t elapsed = wsp_sub(end, start);
wsp_dump(elapsed, "my computation");
Example 2:
Measure the work and span of an iterative computation. The
analyzed code region is non-contiguous in the program's execution trace.
wsp_t wsp_iter = wsp_zero();
while (iteration_condition) {
wsp_t start = wsp_getworkspan();
wsp_t end = wsp_getworkspan();
wsp_t elapsed = wsp_sub(end, start);
wsp_iter = wsp_add(wsp_iter, elapsed);
}
wsp_dump(wsp_iter, "iterative computation");
Benchmarking and visualization Python script
The Cilkscale benchmarking and visualization Python script is found at
share/Cilkscale_vis/cilkscale.py within the OpenCilk installation directory.
It takes as input two Cilkscale-instrumented binaries of the same application
and a number of optional arguments. Its output is a table and set of graphical
plots of parallel performance and scalability measurements.
Prerequisites:
To use the cilkscale.py script, you need:
- Python 3.8 or later.
- (Optional) matplotlib 3.5.0 or later;
only required if producing graphical plots.
Running the cilkscale.py script
$ python3 /opt/opencilk/share/Cilkscale_vis/cilkscale.py ARGUMENTS
Arguments
-
-h, --help
Print usage documentation and exit.
-
-c BIN_CILKSCALE, --cilkscale BIN_CILKSCALE
(Required) Path to program binary instrumented with -fcilktool=cilkscale.
-
-b BIN_CILKSCALE_BENCH, --cilkscale-benchmark BIN_CILKSCALE_BENCH
(Required) Path to program binary instrumented with
-fcilktool=cilkscale-benchmark.
-
-cpus CPU_COUNTS, --cpu-counts CPU_COUNTS
(Optional) Comma-separated list of how many cores to use when running
empirical performance benchmarks. Cilkscale runs the benchmark binary once
for each core count in the list. For each run, the number of parallel Cilk
workers is equal to the number of cores, and the latter are specified
explicitly by setting the processor
affinity of the run. On
systems with simultaneous multithreading
(SMT) (aka
"hyper-threading" on Intel CPUs), Cilkscale only uses distinct physical
cores. On systems with multiple processor nodes with non-uniform memory
access (NUMA),
Cilkscale
selects all cores from one processor before moving on to other processors.
Default: 1,2,...,P, where P is the total number of available physical
cores.
-
-ocsv OUTPUT_CSV, --output-csv OUTPUT_CSV
(Optional) Path to CSV file for table of work/span and benchmarking measurements.
Default: out.csv.
-
-oplot OUTPUT_PLOT, --output-plot OUTPUT_PLOT
(Optional) Path to PDF file for graphical plots of work/span and
benchmarking measurements.
Default: plot.pdf
-
-rplot ROWS_TO_PLOT, --rows-to-plot ROWS_TO_PLOT
(Optional) Comma-separated list of rows (0-indexed) in the CSV table for
which to generate plots; or all to plot all rows.
Default: all.
-
-a ARG1 ARG2 ..., --args ARG1 ARG2 ...
(Optional) Space-separated list of command-line arguments to pass to the
program binary.
Default: no arguments.
Example:
$ /opt/opencilk/bin/clang qsort.c -fopencilk -fcilktool=cilkscale -O3 -o qsort_cs
$ /opt/opencilk/bin/clang qsort.c -fopencilk -fcilktool=cilkscale-benchmark -O3 -o qsort_cs_bench
$ python3 /opt/opencilk/share/Cilkscale_vis/cilkscale.py \
    -c ./qsort_cs -b ./qsort_cs_bench \
    -ocsv qsort-bench.csv -oplot qsort-scalability-plots.pdf \
    --args 100000000
Namespace(args=['100000000'], cilkscale='./qsort_cs', cilkscale_benchmark='./qsort_cs_bench', cpu_counts=None, output_csv='qsort-bench.csv', output_plot='qsort-scalability-plots.pdf', rows_to_plot='all')
>> STDOUT (./qsort_cilkscale 100000000)
Sorting 100000000 random integers
Sort succeeded
<< END STDOUT
>> STDERR (./qsort_cilkscale 100000000)
<< END STDERR
INFO:runner:Generating scalability data for 8 cpus.
INFO:runner:CILK_NWORKERS=1 taskset -c 0 ./qsort_cilkscale_bench 100000000
INFO:runner:CILK_NWORKERS=2 taskset -c 0,2 ./qsort_cilkscale_bench 100000000
INFO:runner:CILK_NWORKERS=3 taskset -c 0,2,4 ./qsort_cilkscale_bench 100000000
INFO:runner:CILK_NWORKERS=4 taskset -c 0,2,4,6 ./qsort_cilkscale_bench 100000000
INFO:runner:CILK_NWORKERS=5 taskset -c 0,2,4,6,8 ./qsort_cilkscale_bench 100000000
INFO:runner:CILK_NWORKERS=6 taskset -c 0,2,4,6,8,10 ./qsort_cilkscale_bench 100000000
INFO:runner:CILK_NWORKERS=7 taskset -c 0,2,4,6,8,10,12 ./qsort_cilkscale_bench 100000000
INFO:runner:CILK_NWORKERS=8 taskset -c 0,2,4,6,8,10,12,14 ./qsort_cilkscale_bench 100000000
INFO:plotter:Generating plot (2 subplots)
An example set of plots produced by the cilkscale.py script is shown
below. In this example, the instrumented application is a parallel quicksort
and the Cilkscale API was used to analyze one program region (tagged as
"sampled_qsort" in the relevant call to wsp_dump()) in addition to the whole
program which is always analyzed by Cilkscale. Details on how these plots were
generated can be found in the Cilkscale user's
guide.
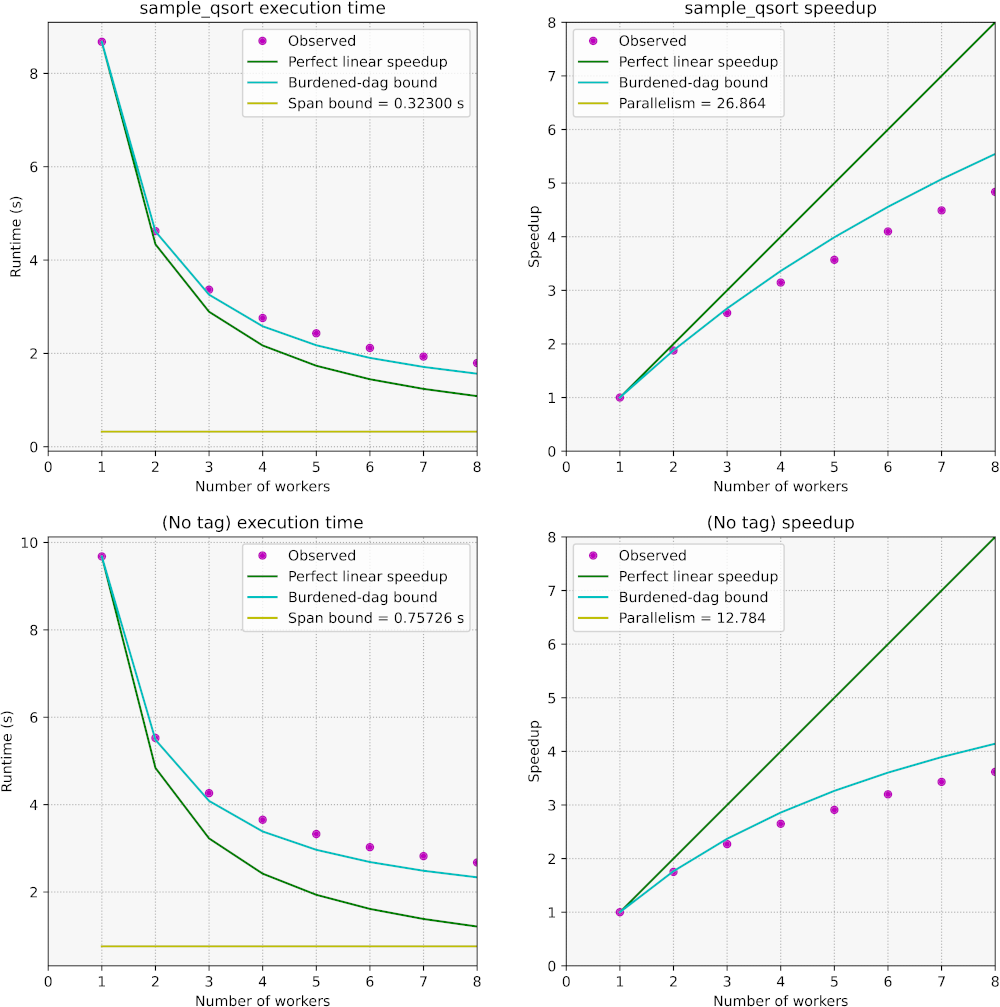
The Cilkscale visualization plots are arranged in two columns and as many rows
as calls to the Cilkscale API wsp_dump() function (plus one untagged row for
the whole-program execution).
Wall-clock execution time. The left-column plots show wall-clock execution
time in seconds as a function of the number of parallel Cilk workers.
Specifically, these figures plot four types of measurements:
- Magenta-colored dots show the observed timing measurements for the
benchmarking runs. Benchmarking runs do not involve work/span analysis
measurement overheads.
- A dark green line shows what the execution time would be if the computation
exhibited perfect linear speedup, that is, if the time on cores were to
be times smaller than the time it took on one core.
- A teal line shows the heuristic burdened-dag bound of the execution time
(the parallel trace of the computation is sometimes also referred to as its
directed acyclic graph or dag). In the absence of other sources of parallel
slowdown such as insufficient memory bandwidth, contention, etc., the
burdened-dag bound serves as a heuristic lower bound for the execution time
if the parallel computation does not exhibit sufficient parallelism and is
not too fine-grained.
- A mustard-yellow horizontal line shows the span bound, that is, the minimum
possible execution time if the computation was run on infinitely many
processing cores and there were no additional overheads for parallel
scheduling, etc.
Parallel speedup. The right-column plots contain the same information as
those in the left column, except that the y-axis shows parallel speedup. That
is, all execution time measurements are divided by the execution time of the
computation on one core. The horizontal line for parallelism (serial execution
time divided by span) is not visible in the speedup plots if its value falls
outside the range of the y-axis.